


How many marketing dollars were wasted last year contacting customers who didn’t buy from you?

It’s easy to look back and see where your investment was ineffective. On the tangible side, there are the catalogs and direct mail pieces sent to people who didn’t buy and resources invested in social networking. Less quantifiable are the effects of lost goodwill and increased spam reports because you are persistently contacting people who have completed their lifespan.
There’s an ongoing branding debate about the value of impressions to build awareness and goodwill. What’s the cost of bad impressions from over marketing? It has to be exponentially higher than the value of good ones.
How many marketing dollars will be wasted this year?
Now, that number is harder to obtain. How do you know which individuals have completed their shopping life cycle with your company? If they are grouped in a high performance segment, they may receive promotions for up to two years after they stopped buying.
The problem is that all new customers are treated equally in most marketing models. The first purchase is the entry fee into the promotional funnel. Individuals are bagged, tagged, and sorted by identifiers like recency, order size, and demographics.
All customers, new or old, are not equal.
Some enter the marketing funnel excited about your products or services and stay a lifetime. Your marketing dollars purchased the privilege of a long term relationship. Others enter out of short term need or curiosity and leave after the first or second purchase. Your investment borrowed a brief promotional opportunity with hit-&-run shoppers.
Traditional marketing analytics won’t distinguish between the two. You have to dig deep into buying behavior to find the early warning signals. Or, you can continue sending promotions until you receive cease and desist notifications or the money runs out.
Acquisition and retention costs are equal.
It costs the same to acquire and market to customers who buy for a full life cycle, hit-&-runners, and the ones who fill the gap between. The first is an asset, the second an expense, and the third can go either way. Your goal is to identify the expensive customers as quickly as possible and minimize your marketing investment.
Before you start digging deep in your customer database for behavioral identifiers, determine the extent of your problem by measuring your retention and attrition by year. If you find that your active database is growing but attrition exceeds acquisition rate, you may be replacing high lifetime value customers with hit-&-runners.
Depreciating customer value is an insidious company killer.
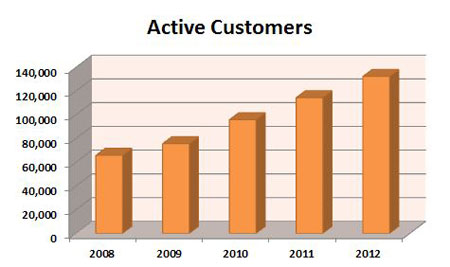
You have to aggressively look for it because it hides deep in your database. Sales reports are misleading because revenue can increase while customer value decreases. A review of a $20 million company provided the following sales history:

The chart is picture perfect with a steady annual increase that moved sales revenue from $9.9 million to $20.5 million over a five year period. The company appears to be on a strong growth track with increasing sales, orders, and average order size.

Average order size has increased by $12.67. The number of active customers in the house file has doubled:
Additional analytics tell a different story.
While the active customer count was increasing, orders per customer were declining. In 2008, customers ordered an average of 3.2 times. By 2012, this had dropped to 2.6 orders per customer. More customers were ordering less often. This translates into increased marketing costs and reduced average lifetime value.
The acquisition rate was strong, peaking at 41% before dropping to 32% in 2012. By itself, the decline is a normal business fluctuation easily explained by external events. But when the attrition rate is factored in, it indicates that the company is in serious trouble:

Between 2008 and 2012, the attrition rate grew from 7.9% to 14.1%. If they had waited for the symptoms to appear on the sales report, it would have been too late to save the business.
Poor quality products were sabotaging their marketing.
The second stage of the review was to identify any trends that contributed to the core customer shift. The marketing plan had been consistent over the five years and there was still room to grow in the market. There were no indications that there was an issue with marketing.
Further analysis revealed a high percentage of one time buyers. A deeper dig into the data linked product quality with the hit-&-runners and growing attrition rate. In an effort to reduce costs, quality had been sacrificed, alienating customers. Fortunately, the story has a happy footnote because the quality issues were resolved and customers have responded well. The same analytics that tell you what you’re doing wrong also show what’s right.
It is impossible to drill deep into customer analytics without revealing challenges and opportunities. Your marketing dollars will always buy some lifetime customers and borrow some hit-&-runners. When you know the difference, and alter your plan to fit, your return on investment increases.
Are you ready to start digging?
If you want to discuss how this applies to your business, please email me at dellis@wilsonellisconsulting.com.